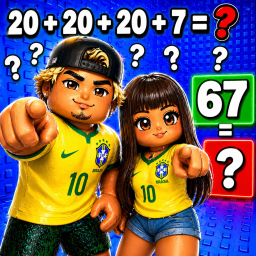
Professore 67 Troll Tower 🇧🇷
A Roblox experience owned by hanox.
ObbyPTTrollObbyDance
Professore 67 Troll Tower 🇧🇷 is a Roblox obstacle-course (obby) experience created in 2026. Players climb, jump, and navigate a course of obstacles toward the end. It has logged 18,574,273 lifetime visits and 423,144 favorites to date. It holds an 85% like rate, with 89 players active at last count. It is listed in the obstacle-course (obby) category on the index.
Description (written by the developer; not a statement by this register)
Welcome to Professore 67 Tower 👋! Climb all the way to the top!🧗 Grab other players and do the viral 20+20+20+7 trend! Dance and race with friends, complete fun challenges, and unlock rewards! ⭐ Join the Group for a free reward! 🎁 Tags: Professore 67, 20+20+20+7, Dance, Trend, Viral, Tower, Obby, Fun, Troll, Grab, Slap, Duo, Couple, Brazil, Dance Tower, Easy Tower, Funny, Challenge, Race, Coins,
Last updated by the developer 14 May 2026, 00:05 UTC.
Live players over time
Growth
| Measured (UTC) | Players | Change |
|---|---|---|
| 22 Aug 2026, 07:50 | 89 | -22 |
| 22 Aug 2026, 06:50 | 111 | -11 |
| 22 Aug 2026, 05:50 | 122 | +17 |
| 22 Aug 2026, 04:50 | 105 | -22 |
| 22 Aug 2026, 03:50 | 127 | -33 |
| 22 Aug 2026, 02:50 | 160 | +8 |
| 22 Aug 2026, 01:50 | 152 | -40 |
| 22 Aug 2026, 00:50 | 192 | +26 |
| 21 Aug 2026, 23:50 | 166 | +28 |
| 21 Aug 2026, 22:50 | 138 | -22 |
| 21 Aug 2026, 21:50 | 160 | +7 |
| 21 Aug 2026, 20:54 | 153 | +11 |
| 10 Aug 2026, 14:05 | 142 | first reading |
Concurrent players at each of our measurements (insert-on-change).
Monetization — game passes
Game passes for sale and their prices, measured from the Roblox passes API. Developer products bought inside the game aren’t publicly listable.
Badge funnel
How many players have ever earned each badge — a proxy for how far players get before they stop. Steep drop-offs mark where a game loses people. Win rate is the past-day share of players who earned it; categories are assigned by a language model from each badge’s own name and description.
Roblox recommends these alongside it
Roblox’s own “games like this” rail, as we recorded it on 17 October 2026. The order is Roblox’s, not ours. Which games it points at most →
Like ratio over time
Growth
| Measured (UTC) | % liked | Change |
|---|---|---|
| 22 Oct 2026, 17:31 | 85 | no change |
| 12 Oct 2026, 17:23 | 85 | no change |
| 2 Oct 2026, 17:22 | 85 | no change |
| 22 Sept 2026, 17:21 | 85 | no change |
| 12 Sept 2026, 17:19 | 85 | no change |
| 2 Sept 2026, 17:18 | 85 | no change |
| 23 Aug 2026, 17:02 | 85 | no change |
| 22 Aug 2026, 07:50 | 85 | no change |
| 22 Aug 2026, 06:50 | 85 | no change |
| 22 Aug 2026, 05:50 | 85 | no change |
| 22 Aug 2026, 04:50 | 85 | no change |
| 22 Aug 2026, 03:50 | 85 | no change |
| 22 Aug 2026, 02:50 | 85 | no change |
| 22 Aug 2026, 01:50 | 85 | no change |
| 22 Aug 2026, 00:50 | 85 | no change |
| 21 Aug 2026, 23:50 | 85 | no change |
| 21 Aug 2026, 22:50 | 85 | no change |
| 21 Aug 2026, 21:50 | 85 | no change |
| 21 Aug 2026, 20:54 | 85 | no change |
| 13 Aug 2026, 17:02 | 85 | first reading |
Percentage of votes that are likes, at each of our measurements. A falling line is a game losing its crowd’s goodwill.