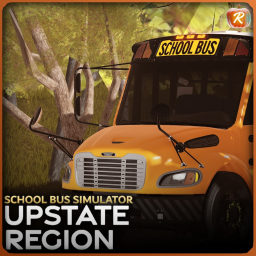
Regional School Bus Co 🚌
A Roblox experience owned by Regional Bus Community.
SimulatorENschool busvehicle simulationroleplay
Regional School Bus Co 🚌 is a simulator experience from 2026 with over 1.4 million lifetime visits. It records 96 playing now, a like rating of 79%, 10,290 favourites.
Description (written by the developer; not a statement by this register)
👋 Welcome to RBC's School Bus Simulator: Upstate Region (formerly Regional Bus Company) ⚠️ THIS GAME IS NOT DESIGNED FOR LOW-END DEVICES. High-end device recommended for best performance. 🚌 Drive realistic school buses. Choose your bus number, transport students, refuel, and explore a full bus company roleplay experience. 💫 "Tomorrow's Transportation Since 2020" 🌐 We support Mobile, PC, Xbox & PS5 © 2026 Regional Bus Community (formerly Regional Bus Company). All rights reserved.
Last updated by the developer 17 Aug 2026, 01:51 UTC.
Live players over time
Growth
| Measured (UTC) | Players | Change |
|---|---|---|
| 22 Aug 2026, 07:50 | 96 | -16 |
| 22 Aug 2026, 06:50 | 112 | +3 |
| 22 Aug 2026, 05:50 | 109 | -63 |
| 22 Aug 2026, 04:50 | 172 | -95 |
| 22 Aug 2026, 03:50 | 267 | -75 |
| 22 Aug 2026, 02:50 | 342 | -4 |
| 22 Aug 2026, 01:50 | 346 | -8 |
| 22 Aug 2026, 00:50 | 354 | +14 |
| 21 Aug 2026, 23:50 | 340 | -49 |
| 21 Aug 2026, 22:50 | 389 | +65 |
| 21 Aug 2026, 21:50 | 324 | +20 |
| 21 Aug 2026, 20:54 | 304 | +53 |
| 10 Aug 2026, 15:50 | 251 | first reading |
Concurrent players at each of our measurements (insert-on-change).
Monetization — game passes
Game passes for sale and their prices, measured from the Roblox passes API. Developer products bought inside the game aren’t publicly listable.
Badge funnel
How many players have ever earned each badge — a proxy for how far players get before they stop. Steep drop-offs mark where a game loses people. Win rate is the past-day share of players who earned it; categories are assigned by a language model from each badge’s own name and description.
Roblox recommends these alongside it
Roblox’s own “games like this” rail, as we recorded it on 17 October 2026. The order is Roblox’s, not ours. Which games it points at most →
Like ratio over time
Growth
| Measured (UTC) | % liked | Change |
|---|---|---|
| 23 Oct 2026, 15:20 | 78 | -1 |
| 13 Oct 2026, 15:19 | 79 | no change |
| 3 Oct 2026, 15:19 | 79 | no change |
| 23 Sept 2026, 15:18 | 79 | no change |
| 13 Sept 2026, 15:17 | 79 | no change |
| 3 Sept 2026, 15:17 | 79 | no change |
| 24 Aug 2026, 15:16 | 79 | no change |
| 22 Aug 2026, 07:50 | 79 | no change |
| 22 Aug 2026, 06:50 | 79 | no change |
| 22 Aug 2026, 05:50 | 79 | no change |
| 22 Aug 2026, 04:50 | 79 | -1 |
| 22 Aug 2026, 03:50 | 80 | no change |
| 22 Aug 2026, 02:50 | 80 | no change |
| 22 Aug 2026, 01:50 | 80 | no change |
| 22 Aug 2026, 00:50 | 80 | no change |
| 21 Aug 2026, 23:50 | 80 | no change |
| 21 Aug 2026, 22:50 | 80 | no change |
| 21 Aug 2026, 21:50 | 80 | no change |
| 21 Aug 2026, 20:54 | 80 | no change |
| 14 Aug 2026, 15:15 | 80 | first reading |
Percentage of votes that are likes, at each of our measurements. A falling line is a game losing its crowd’s goodwill.
Icon history
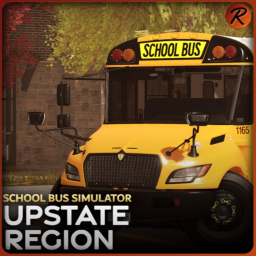
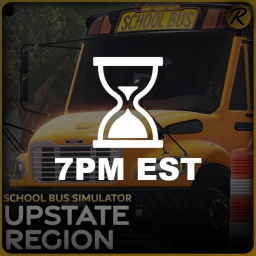
Every distinct icon we’ve recorded for this game, newest first — watching how it rebrands to chase the algorithm.