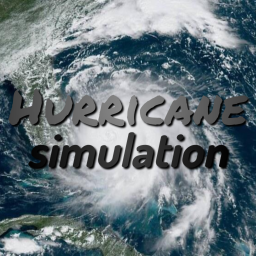
[PRE-ALPHA] Hurricane Simulation
A Roblox experience owned by SHARK Interactive.
SimulatorENsimulationweatherpre-alpha
Description (written by the developer; not a statement by this register)
[NOTE THIS IS STILL IN TESTING PHASE]
Last updated by the developer 14 Oct 2024, 16:43 UTC.
Live players over time
Growth
Growth history is still building. We hold one measurement for this entry. A trend needs at least two, taken days apart — so this will fill in on its own rather than being estimated. We do not publish numbers we have not measured.
| Measured (UTC) | Players | Change |
|---|---|---|
| 11 Aug 2026, 12:17 | 0 | first reading |
Concurrent players at each of our measurements (insert-on-change).
Badge funnel
How many players have ever earned each badge — a proxy for how far players get before they stop. Steep drop-offs mark where a game loses people. Win rate is the past-day share of players who earned it; categories are assigned by a language model from each badge’s own name and description.
Like ratio over time
Growth
| Measured (UTC) | % liked | Change |
|---|---|---|
| 24 Oct 2026, 11:20 | 85 | no change |
| 4 Oct 2026, 11:18 | 85 | no change |
| 24 Sept 2026, 11:17 | 85 | -1 |
| 14 Sept 2026, 08:36 | 86 | no change |
| 15 Aug 2026, 06:52 | 86 | first reading |
Percentage of votes that are likes, at each of our measurements. A falling line is a game losing its crowd’s goodwill.