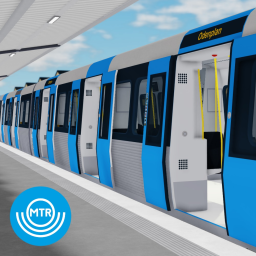
Stockholm Metro, Sweden: T17
A Roblox experience owned by MTR Nordic RBLX.
SimulatorENsimulationpublic transportrealistic
Description (written by the developer; not a statement by this register)
Experience Stockholm like never before! Fly through the tunnels in ROBLOX's most realistic representation of the Stockholm Metro and its core city section between Alvik and Hötorget. Brought to you by MTR Nordic RBLX. This game features true to life systems including: - Detailed train models - Departure boards with cutting edge real time train information - Accurate representations of all stations along the line - And much more! Make sure to join our group and our communications server listed under "Social Links" below, if your account is eligible. Welcome on board!
Last updated by the developer 31 Jul 2026, 13:56 UTC.
Live players over time
Growth
Growth history is still building. We hold one measurement for this entry. A trend needs at least two, taken days apart — so this will fill in on its own rather than being estimated. We do not publish numbers we have not measured.
| Measured (UTC) | Players | Change |
|---|---|---|
| 10 Aug 2026, 23:05 | 0 | first reading |
Concurrent players at each of our measurements (insert-on-change).
Badge funnel
How many players have ever earned each badge — a proxy for how far players get before they stop. Steep drop-offs mark where a game loses people. Win rate is the past-day share of players who earned it; categories are assigned by a language model from each badge’s own name and description.
Like ratio over time
Growth
| Measured (UTC) | % liked | Change |
|---|---|---|
| 13 Nov 2026, 20:53 | 85 | no change |
| 3 Nov 2026, 20:15 | 85 | no change |
| 24 Oct 2026, 20:07 | 85 | no change |
| 4 Oct 2026, 19:53 | 85 | no change |
| 24 Sept 2026, 19:53 | 85 | -1 |
| 14 Sept 2026, 16:21 | 86 | no change |
| 4 Sept 2026, 16:20 | 86 | no change |
| 15 Aug 2026, 14:38 | 86 | first reading |
Percentage of votes that are likes, at each of our measurements. A falling line is a game losing its crowd’s goodwill.