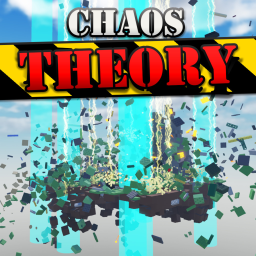
Chaos Theory
A Roblox experience owned by 1028 Games.
SurvivalENsurvivalrandomized eventsisland hopping
Description (written by the developer; not a statement by this register)
Living is optional. Chaotic events are happening every few seconds, and all you have to survive on are a few floating islands and the mercy of RNG. Explore randomized unique sets of islands, survive terrifying disasters every few seconds, and show off to your friends when you win B) inspired by Plates of Fate, Lab Experiment, and Natural Disaster Survival
Last updated by the developer 20 Jan 2025, 02:20 UTC.
Live players over time
Growth
Growth history is still building. We hold one measurement for this entry. A trend needs at least two, taken days apart — so this will fill in on its own rather than being estimated. We do not publish numbers we have not measured.
| Measured (UTC) | Players | Change |
|---|---|---|
| 10 Aug 2026, 16:16 | 0 | first reading |
Concurrent players at each of our measurements (insert-on-change).
Monetization — game passes
Game passes for sale and their prices, measured from the Roblox passes API. Developer products bought inside the game aren’t publicly listable.
Badge funnel
How many players have ever earned each badge — a proxy for how far players get before they stop. Steep drop-offs mark where a game loses people. Win rate is the past-day share of players who earned it; categories are assigned by a language model from each badge’s own name and description.
Like ratio over time
Growth
| Measured (UTC) | % liked | Change |
|---|---|---|
| 15 Oct 2026, 19:05 | 98 | no change |
| 15 Sept 2026, 18:36 | 98 | no change |
| 16 Aug 2026, 18:31 | 98 | first reading |
Percentage of votes that are likes, at each of our measurements. A falling line is a game losing its crowd’s goodwill.