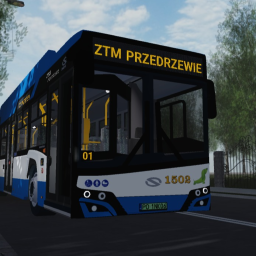
Urbanmove ZTM Przedrzewie
A Roblox experience owned by Shiba Studi0s.
SimulatorPLbus simulationpolish transitco-op driving
Description (written by the developer; not a statement by this register)
©Urbanmove ZTM Prefront ===================================================================================================================================== Play with a friend! 👾 Drive bus! Tour the map! 🗺️ Have fun! ⭐ ===================================================================================================================================== Solaris Urbino 12 III and Kapena Urby 65c is actually buying. This is no't my model
Last updated by the developer 27 Jul 2026, 13:16 UTC.
Live players over time
Growth
Growth history is still building. We hold one measurement for this entry. A trend needs at least two, taken days apart — so this will fill in on its own rather than being estimated. We do not publish numbers we have not measured.
| Measured (UTC) | Players | Change |
|---|---|---|
| 12 Aug 2026, 10:51 | 0 | first reading |
Concurrent players at each of our measurements (insert-on-change).
Badge funnel
How many players have ever earned each badge — a proxy for how far players get before they stop. Steep drop-offs mark where a game loses people. Win rate is the past-day share of players who earned it; categories are assigned by a language model from each badge’s own name and description.
Like ratio over time
Growth
| Measured (UTC) | % liked | Change |
|---|---|---|
| 14 Nov 2026, 21:46 | 76 | -2 |
| 16 Aug 2026, 20:33 | 78 | first reading |
Percentage of votes that are likes, at each of our measurements. A falling line is a game losing its crowd’s goodwill.