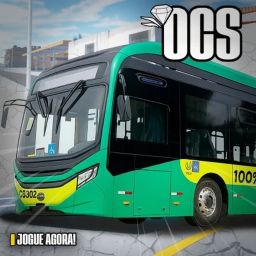
Curitiba Buses | OCS 🚍
A Roblox experience owned by Ônibus de Curitiba.
SimulatorENbus simulationcity explorationvehicle progression
Curitiba Buses | OCS 🚍 is a simulator experience created on 2025-08-31. The game has recorded 944,036 lifetime visits and 38,214 favorites. Currently, zero users are playing. The experience holds a 76% like percentage. It features maps inspired by real Curitiba regions and a progression system for vehicle unlocking.
Description (written by the developer; not a statement by this register)
🚌 Curitiba Bus Explore the capital of Paraná behind the wheel of classic models of Curitiba's urban transport. With detailed sceneries, a realistic system of routes and stops, and a fleet true to real buses, this simulator offers an immersive and authentic experience for those passionate about urban mobility. ✨ Highlights: ✅ Maps inspired by real regions of Curitiba ✅ Curitiba bus models with plenty of details ✅ Progression system with vehicle unlocking ✅ Complete simulation with routes, schedules, and its own economy 🚍 Start your journey now and show that you're a master of the wheel!
Last updated by the developer 8 Aug 2026, 03:59 UTC.
Live players over time
Growth
Growth history is still building. We hold one measurement for this entry. A trend needs at least two, taken days apart — so this will fill in on its own rather than being estimated. We do not publish numbers we have not measured.
| Measured (UTC) | Players | Change |
|---|---|---|
| 10 Aug 2026, 16:37 | 0 | first reading |
Concurrent players at each of our measurements (insert-on-change).
Badge funnel
How many players have ever earned each badge — a proxy for how far players get before they stop. Steep drop-offs mark where a game loses people. Win rate is the past-day share of players who earned it; categories are assigned by a language model from each badge’s own name and description.
Like ratio over time
Growth
| Measured (UTC) | % liked | Change |
|---|---|---|
| 23 Oct 2026, 19:04 | 76 | +1 |
| 13 Oct 2026, 19:02 | 75 | -1 |
| 3 Oct 2026, 19:02 | 76 | no change |
| 23 Sept 2026, 19:00 | 76 | +1 |
| 13 Sept 2026, 18:15 | 75 | no change |
| 3 Sept 2026, 18:06 | 75 | -1 |
| 24 Aug 2026, 16:06 | 76 | no change |
| 14 Aug 2026, 16:04 | 76 | first reading |
Percentage of votes that are likes, at each of our measurements. A falling line is a game losing its crowd’s goodwill.