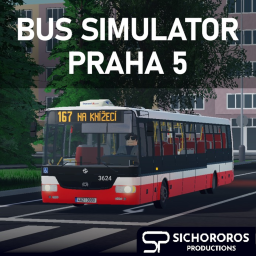
Bus simulator Praha 5 (PŘEDBĚŽNÝ PŘÍSTUP)
A Roblox experience owned by SICHOROROS PRODUCTIONS.
SimulatorCSbus drivingPraguerealistic simulation
Description (written by the developer; not a statement by this register)
BSP5 je nový simulátor autobusů v lokalitě Prahy 5 (konkrétně Košíř a Smíchova). Vyzkoušejte si řízení autobusu SOR NB 12 na lince 167 v úseku Na Knížecí - Klamovka. Ve hře jsou různé funkce, které v ostatních simulátorech nenajdete (např. realistické řazení motoru a ozvučení, atd.) Doufáme, že se vám bude hra líbit. Pokud se vám hra líbí, budeme rádi za like. UPOZORNĚNÍ: Hra je v předběžném přístupu, zatím není dokončena a mapa je na mnoha místech prázdná! Děkujeme za pochopení. Hra od AdamT137 Verze 0.2.2 (předběžný přístup)
Last updated by the developer 10 Aug 2026, 19:56 UTC.
Live players over time
Growth
Growth history is still building. We hold one measurement for this entry. A trend needs at least two, taken days apart — so this will fill in on its own rather than being estimated. We do not publish numbers we have not measured.
| Measured (UTC) | Players | Change |
|---|---|---|
| 11 Aug 2026, 05:52 | 1 | first reading |
Concurrent players at each of our measurements (insert-on-change).
Badge funnel
How many players have ever earned each badge — a proxy for how far players get before they stop. Steep drop-offs mark where a game loses people. Win rate is the past-day share of players who earned it; categories are assigned by a language model from each badge’s own name and description.
Like ratio over time
Growth
| Measured (UTC) | % liked | Change |
|---|---|---|
| 28 Oct 2026, 09:19 | 86 | -1 |
| 18 Oct 2026, 08:50 | 87 | +4 |
| 8 Oct 2026, 08:48 | 83 | +1 |
| 28 Sept 2026, 08:33 | 82 | -1 |
| 18 Sept 2026, 02:03 | 83 | no change |
| 8 Sept 2026, 02:01 | 83 | +1 |
| 29 Aug 2026, 01:32 | 82 | no change |
| 19 Aug 2026, 01:03 | 82 | first reading |
Percentage of votes that are likes, at each of our measurements. A falling line is a game losing its crowd’s goodwill.