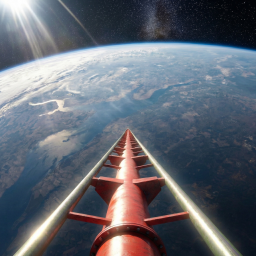
🎢 Highest Rollercoaster
A Roblox experience owned by funny & silly games.
SimulatorENclimbingphysicssimulation
🎢 Highest Rollercoaster is a simulator experience created on 2026-03-19. It records 167 concurrent players, 24,939,026 lifetime visits, a 63% like percentage, and 56,377 favorites.
Description (written by the developer; not a statement by this register)
Welcome to 🎢 HIGHEST Roller Coaster! HOW TO PLAY: 🪜 Climb the highest roller coaster on Roblox! ⏳ Wait for your turn 🎢 Ride down and enjoy your ride!
Last updated by the developer 13 Aug 2026, 19:38 UTC.
Live players over time
Growth
| Measured (UTC) | Players | Change |
|---|---|---|
| 21 Aug 2026, 22:50 | 88 | -34 |
| 21 Aug 2026, 21:50 | 122 | +18 |
| 21 Aug 2026, 20:54 | 104 | -72 |
| 10 Aug 2026, 14:34 | 176 | first reading |
Concurrent players at each of our measurements (insert-on-change).
Badge funnel
How many players have ever earned each badge — a proxy for how far players get before they stop. Steep drop-offs mark where a game loses people. Win rate is the past-day share of players who earned it; categories are assigned by a language model from each badge’s own name and description.
Like ratio over time
Growth
| Measured (UTC) | % liked | Change |
|---|---|---|
| 1 Nov 2026, 16:33 | 63 | no change |
| 22 Oct 2026, 16:31 | 63 | no change |
| 12 Oct 2026, 16:30 | 63 | no change |
| 2 Oct 2026, 16:22 | 63 | no change |
| 22 Sept 2026, 16:21 | 63 | no change |
| 12 Sept 2026, 16:18 | 63 | no change |
| 2 Sept 2026, 16:17 | 63 | no change |
| 23 Aug 2026, 16:02 | 63 | no change |
| 21 Aug 2026, 22:50 | 63 | no change |
| 21 Aug 2026, 21:50 | 63 | no change |
| 21 Aug 2026, 20:54 | 63 | first reading |
Percentage of votes that are likes, at each of our measurements. A falling line is a game losing its crowd’s goodwill.