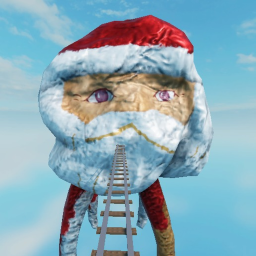
Cart Ride Into Goo Goo Gaga
A Roblox experience owned by gagoguga.
OtherENcart ridingphysics-basedmeme culture
Cart Ride Into Goo Goo Gaga is an experience in the other genre, created on 2026-03-25. It has recorded 548,409 lifetime visits and 893 favorites. Currently, 20 users are playing. The experience holds a 37% like percentage.
Description (written by the developer; not a statement by this register)
Cart Ride Into Goo Goo Gaga
Last updated by the developer 1 Aug 2026, 06:20 UTC.
Live players over time
Growth
Growth history is still building. We hold one measurement for this entry. A trend needs at least two, taken days apart — so this will fill in on its own rather than being estimated. We do not publish numbers we have not measured.
| Measured (UTC) | Players | Change |
|---|---|---|
| 10 Aug 2026, 17:53 | 21 | first reading |
Concurrent players at each of our measurements (insert-on-change).
Monetization — game passes
Game passes for sale and their prices, measured from the Roblox passes API. Developer products bought inside the game aren’t publicly listable.
Badge funnel
How many players have ever earned each badge — a proxy for how far players get before they stop. Steep drop-offs mark where a game loses people. Win rate is the past-day share of players who earned it; categories are assigned by a language model from each badge’s own name and description.
Like ratio over time
Growth
| Measured (UTC) | % liked | Change |
|---|---|---|
| 3 Nov 2026, 00:02 | 34 | no change |
| 24 Oct 2026, 00:01 | 34 | no change |
| 14 Oct 2026, 00:00 | 34 | no change |
| 3 Oct 2026, 23:53 | 34 | +1 |
| 23 Sept 2026, 23:52 | 33 | -1 |
| 13 Sept 2026, 22:34 | 34 | no change |
| 3 Sept 2026, 22:21 | 34 | -2 |
| 24 Aug 2026, 20:47 | 36 | -1 |
| 14 Aug 2026, 20:47 | 37 | first reading |
Percentage of votes that are likes, at each of our measurements. A falling line is a game losing its crowd’s goodwill.