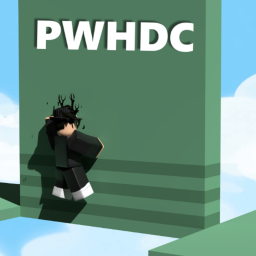
Pancake's Wall Hop Difficulty Chart
A Roblox experience owned by CanPan Studios.
ObbyENwallhop glitchdifficulty chartobby
Pancake's Wall Hop Difficulty Chart is an obby experience created on 2020-11-04. It records 174 concurrent players, 98,395,029 lifetime visits, a 68% like percentage, and 83,869 favorites. The game utilizes a wall-hopping mechanic within an obstacle course structure, featuring saved progress and updated chat translation capabilities.
Description (written by the developer; not a statement by this register)
Welcome to Pancakes Wallhop Difficulty chart! [Update 1.21!] Chat Features Update! - Chat has been updated to include translation with roblox supported languages - New overhead chat name and tags, with coloured bubbles 📝Check out the entire update log here: https://devforum.roblox.com/t/1380845 Shutdown = UPDATE/BUG FIX Wallhopping is a glitch in Roblox that this game takes advantage of, to create an obby with increasing difficulty as you progress! If you do not know how to wallhop, there are many YouTube videos with great explanations! 📈 Your progress saves, so you can take a break and come back later! ⭐Current stages: 93! ⚠️ All stages have been tested and are possible! 💀 Press R to reset! 🎁 Join the community server for giveaways! 👉Join our group to get notified about game updates! https://www.roblox.com/groups/5728104/CanPan-Studios#!/about
Last updated by the developer 5 Jul 2025, 20:23 UTC.
Live players over time
Growth
| Measured (UTC) | Players | Change |
|---|---|---|
| 21 Aug 2026, 20:54 | 30 | -42 |
| 10 Aug 2026, 14:17 | 72 | first reading |
Concurrent players at each of our measurements (insert-on-change).
Monetization — game passes
Game passes for sale and their prices, measured from the Roblox passes API. Developer products bought inside the game aren’t publicly listable.
Badge funnel
How many players have ever earned each badge — a proxy for how far players get before they stop. Steep drop-offs mark where a game loses people. Win rate is the past-day share of players who earned it; categories are assigned by a language model from each badge’s own name and description.
Roblox recommends these alongside it
Roblox’s own “games like this” rail, as we recorded it on 17 October 2026. The order is Roblox’s, not ours. Which games it points at most →
Like ratio over time
Growth
| Measured (UTC) | % liked | Change |
|---|---|---|
| 22 Oct 2026, 13:32 | 68 | no change |
| 12 Oct 2026, 13:31 | 68 | no change |
| 2 Oct 2026, 13:30 | 68 | no change |
| 22 Sept 2026, 13:23 | 68 | no change |
| 12 Sept 2026, 13:21 | 68 | no change |
| 2 Sept 2026, 13:19 | 68 | no change |
| 23 Aug 2026, 13:15 | 68 | no change |
| 21 Aug 2026, 20:54 | 68 | first reading |
Percentage of votes that are likes, at each of our measurements. A falling line is a game losing its crowd’s goodwill.